Data of a Different Color
Posted July 18, 2014
In our short exploration on perspective this week, we have investigated two projects that changed the physical environment in some way to reveal a new point of view. Felice Varini paints the outside world to create geometric figures seen from a particular view point, granting the place a new identity and trait. The Bjarke Ingels Group created a maze in the National Building Museum that invests the museum with a new experience and a new location from which to view the Grand Hall.
But physical construction and changes in the built environment are not the only way that perspective can be altered in a place to create new experiences. Information is another way that designers can shift user perspectives to create a new sense of place. Today we are going investigate the secondary definition of perspective, that of a changed point of view. And this will be achieved through data.
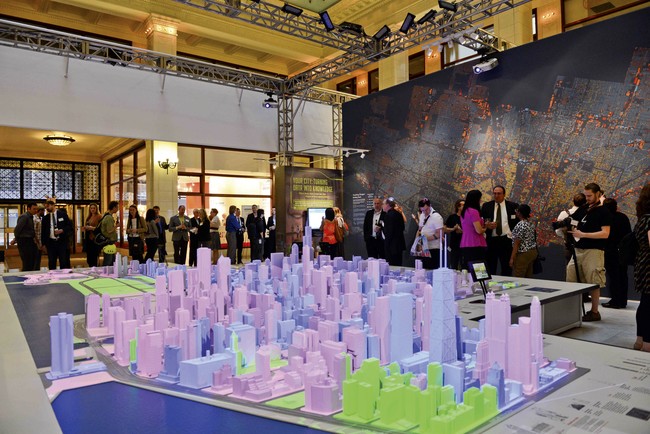
A dazzling display of data is now taking place at the Chicago Architecture Foundation (CAF) that revitalizes and reveals the makeup of the city. The exhibition is entitled, Chicago: City of Big Data. The centerpiece of CAF is a 320 square foot resin replica of the city’s downtown that is changed every year to highlight the changes in the real downtown. The foundation has turned this model into an interpretive piece through which to see the city’s changing data.
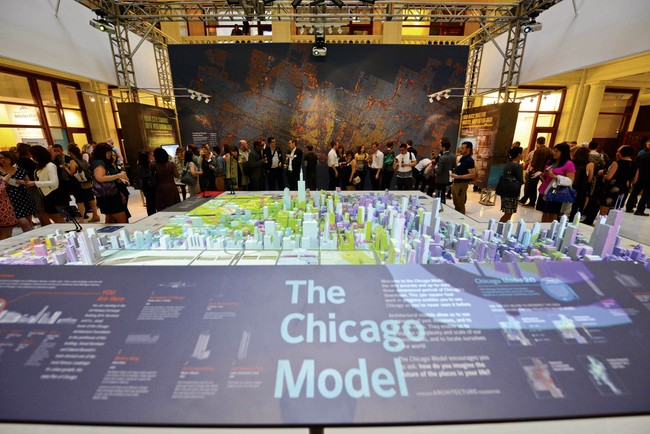
The model is enhanced for the exhibition with a lighting installation that projects color and animation to visualize data sets atop the scale buildings. As various data sets are displayed, the colors shift and move across the skyline display, geo-located to the individual buildings and neighborhoods.
There is also a “Chicago Dashboard” that displays real-time updates on a range of data sets. Visitors can see and interact with the data on a series of high resolution displays. This digital data includes bus and train arrival times, the number of Divvy bike share bikes that are available, heat maps, building permits, and economic data. All of this updates in real time giving viewers a peek into the aggregate workings of the city in which they live.
To complete the exhibit, the CAF built a light-up backdrop larger than the model itself. On this dynamic backdrop every building in the city is color-coded according to the era in which it was developed. Yellow denotes the oldest. Blue designates 1900-1945. The orange buildings were built from 1964-1979 and the red between 1980-2014. This visualization of the waves of development and construction unveils new forms of interpretation for a grand city.
This is not the only exhibit that take data in and of the urban environment as its lead. The City Data Future Exhibition and Symposium will take on data in the European urban landscape this fall. NYC Open Data is a resource for city supported developers to use for the creation of apps to aid the city’s citizens. What is hopeful about this new venture to visualizing the data of our lives are the directions and view points that it can reveal for new interactive design.
Designers are challenged with developing a user experience when creating. Looking for guides in various forms, we rely upon precedence, on-the-ground research, and conversations with clients. Data, and the use of big data in particular, is now opening up as a new tool of development. Trends in data reveal new particulars of use in existing space, expose engrained habits of large groups or established interactions, and uncover untapped potential in environments that are yet to be used.
The data exhibition in Chicago is one in a long line of steps that designers, planners, and others will be able to use to grant a new perspective into the design process. The resulting data from the exhibition will be open for public use after it closes. In the upcoming design paradigm — the paradigm that begins now — shifting perspectives will be an important factor in design. We will use the tools from various fields to create new experiences that shift view points and influence change. We will keep investigating this trend over time and bring new projects to this blog that help us expand our designs and design ability.
Join The Conversation